03-实验数据分析
提示
经过允许的才会发布在此,也为了宣传。感谢,这些学员的支持。
0. 前言
你好,我是悦创。


1. 需求描述
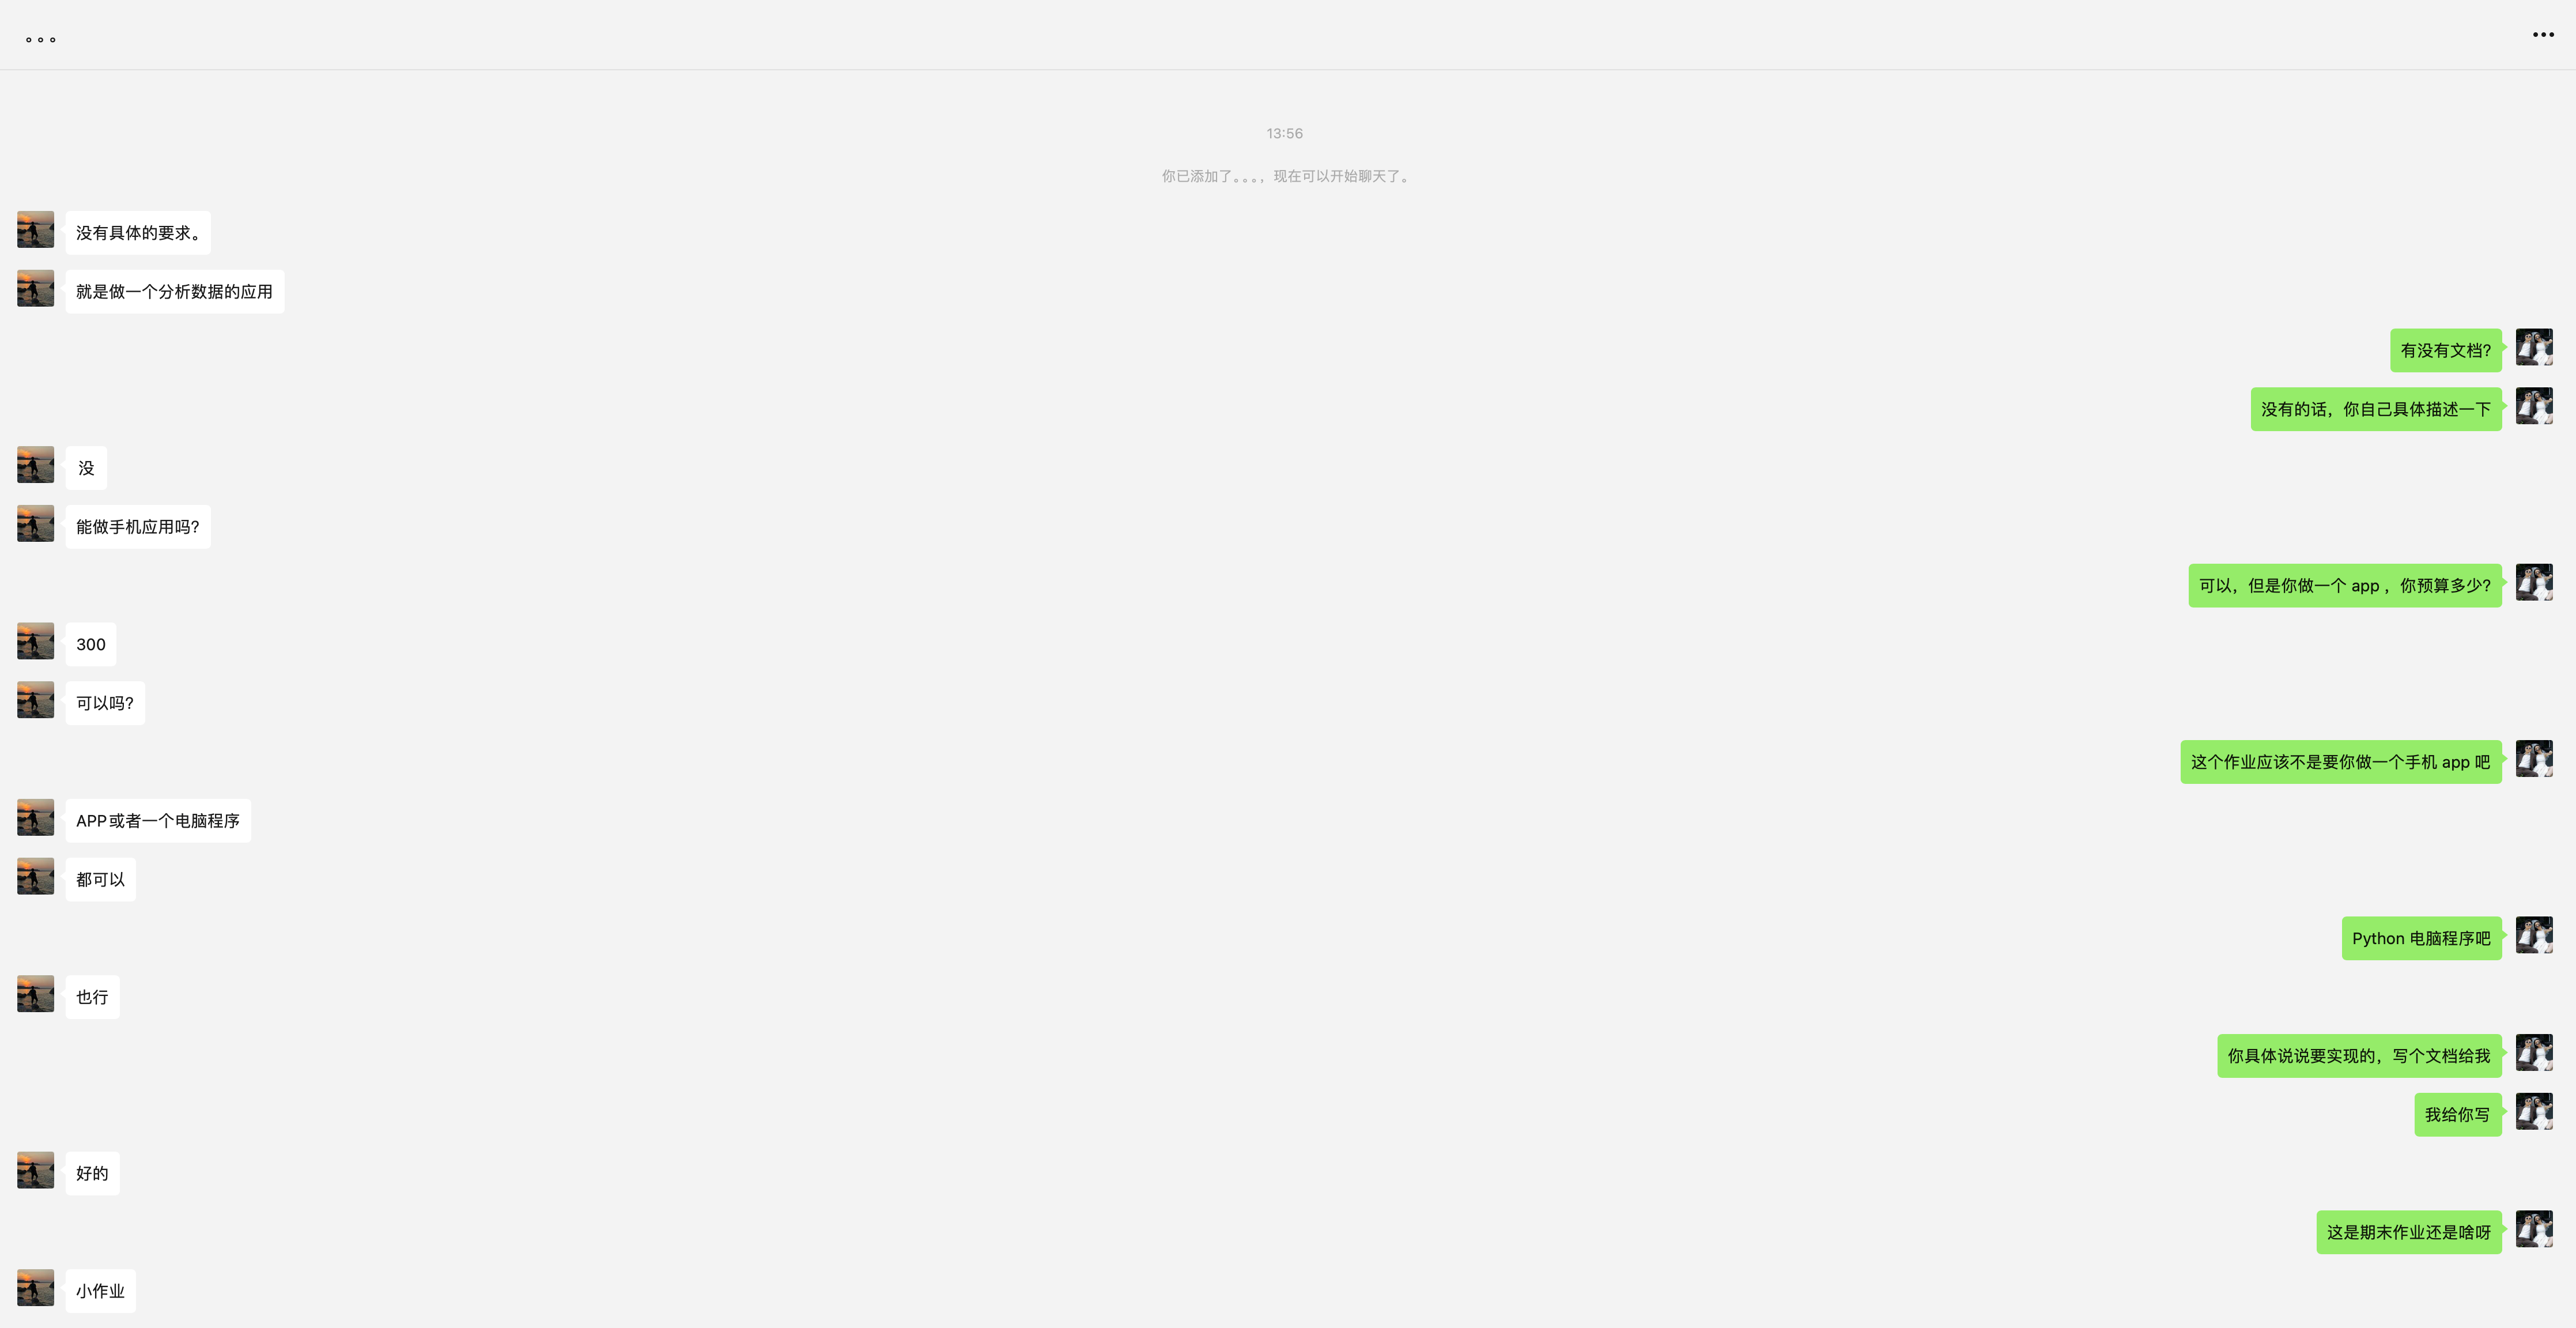
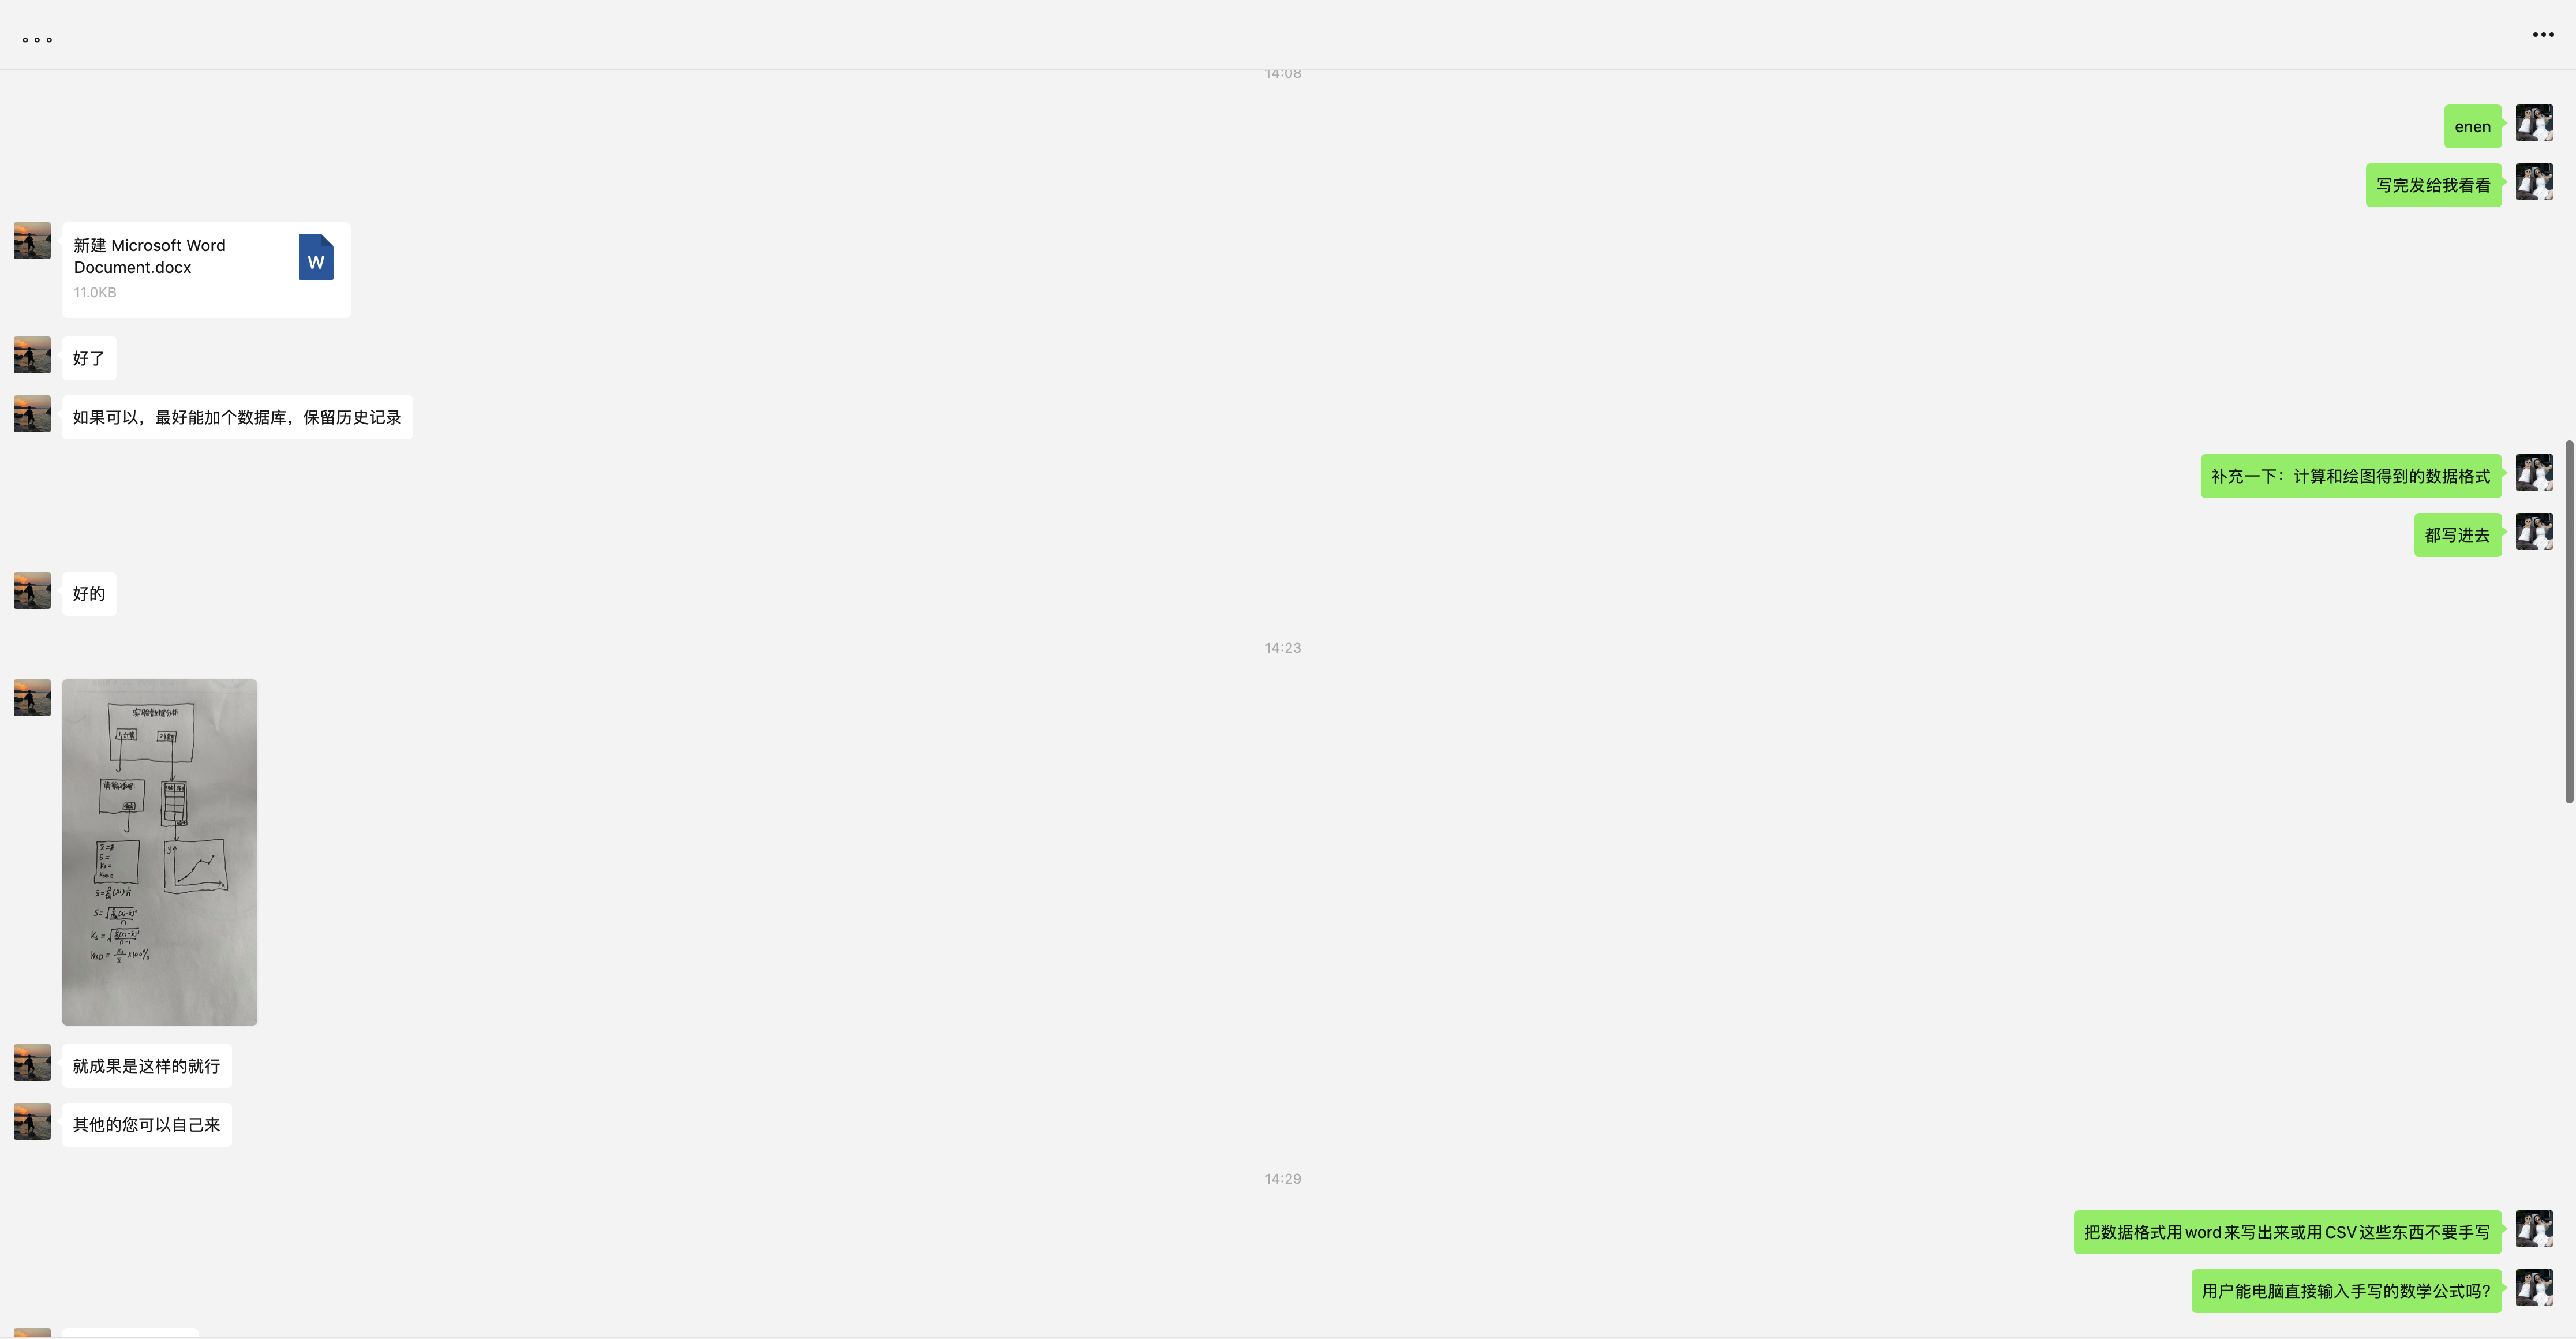
程序名:实验数据分析
要求:点开以后弹出窗口提供两个选项
计算:
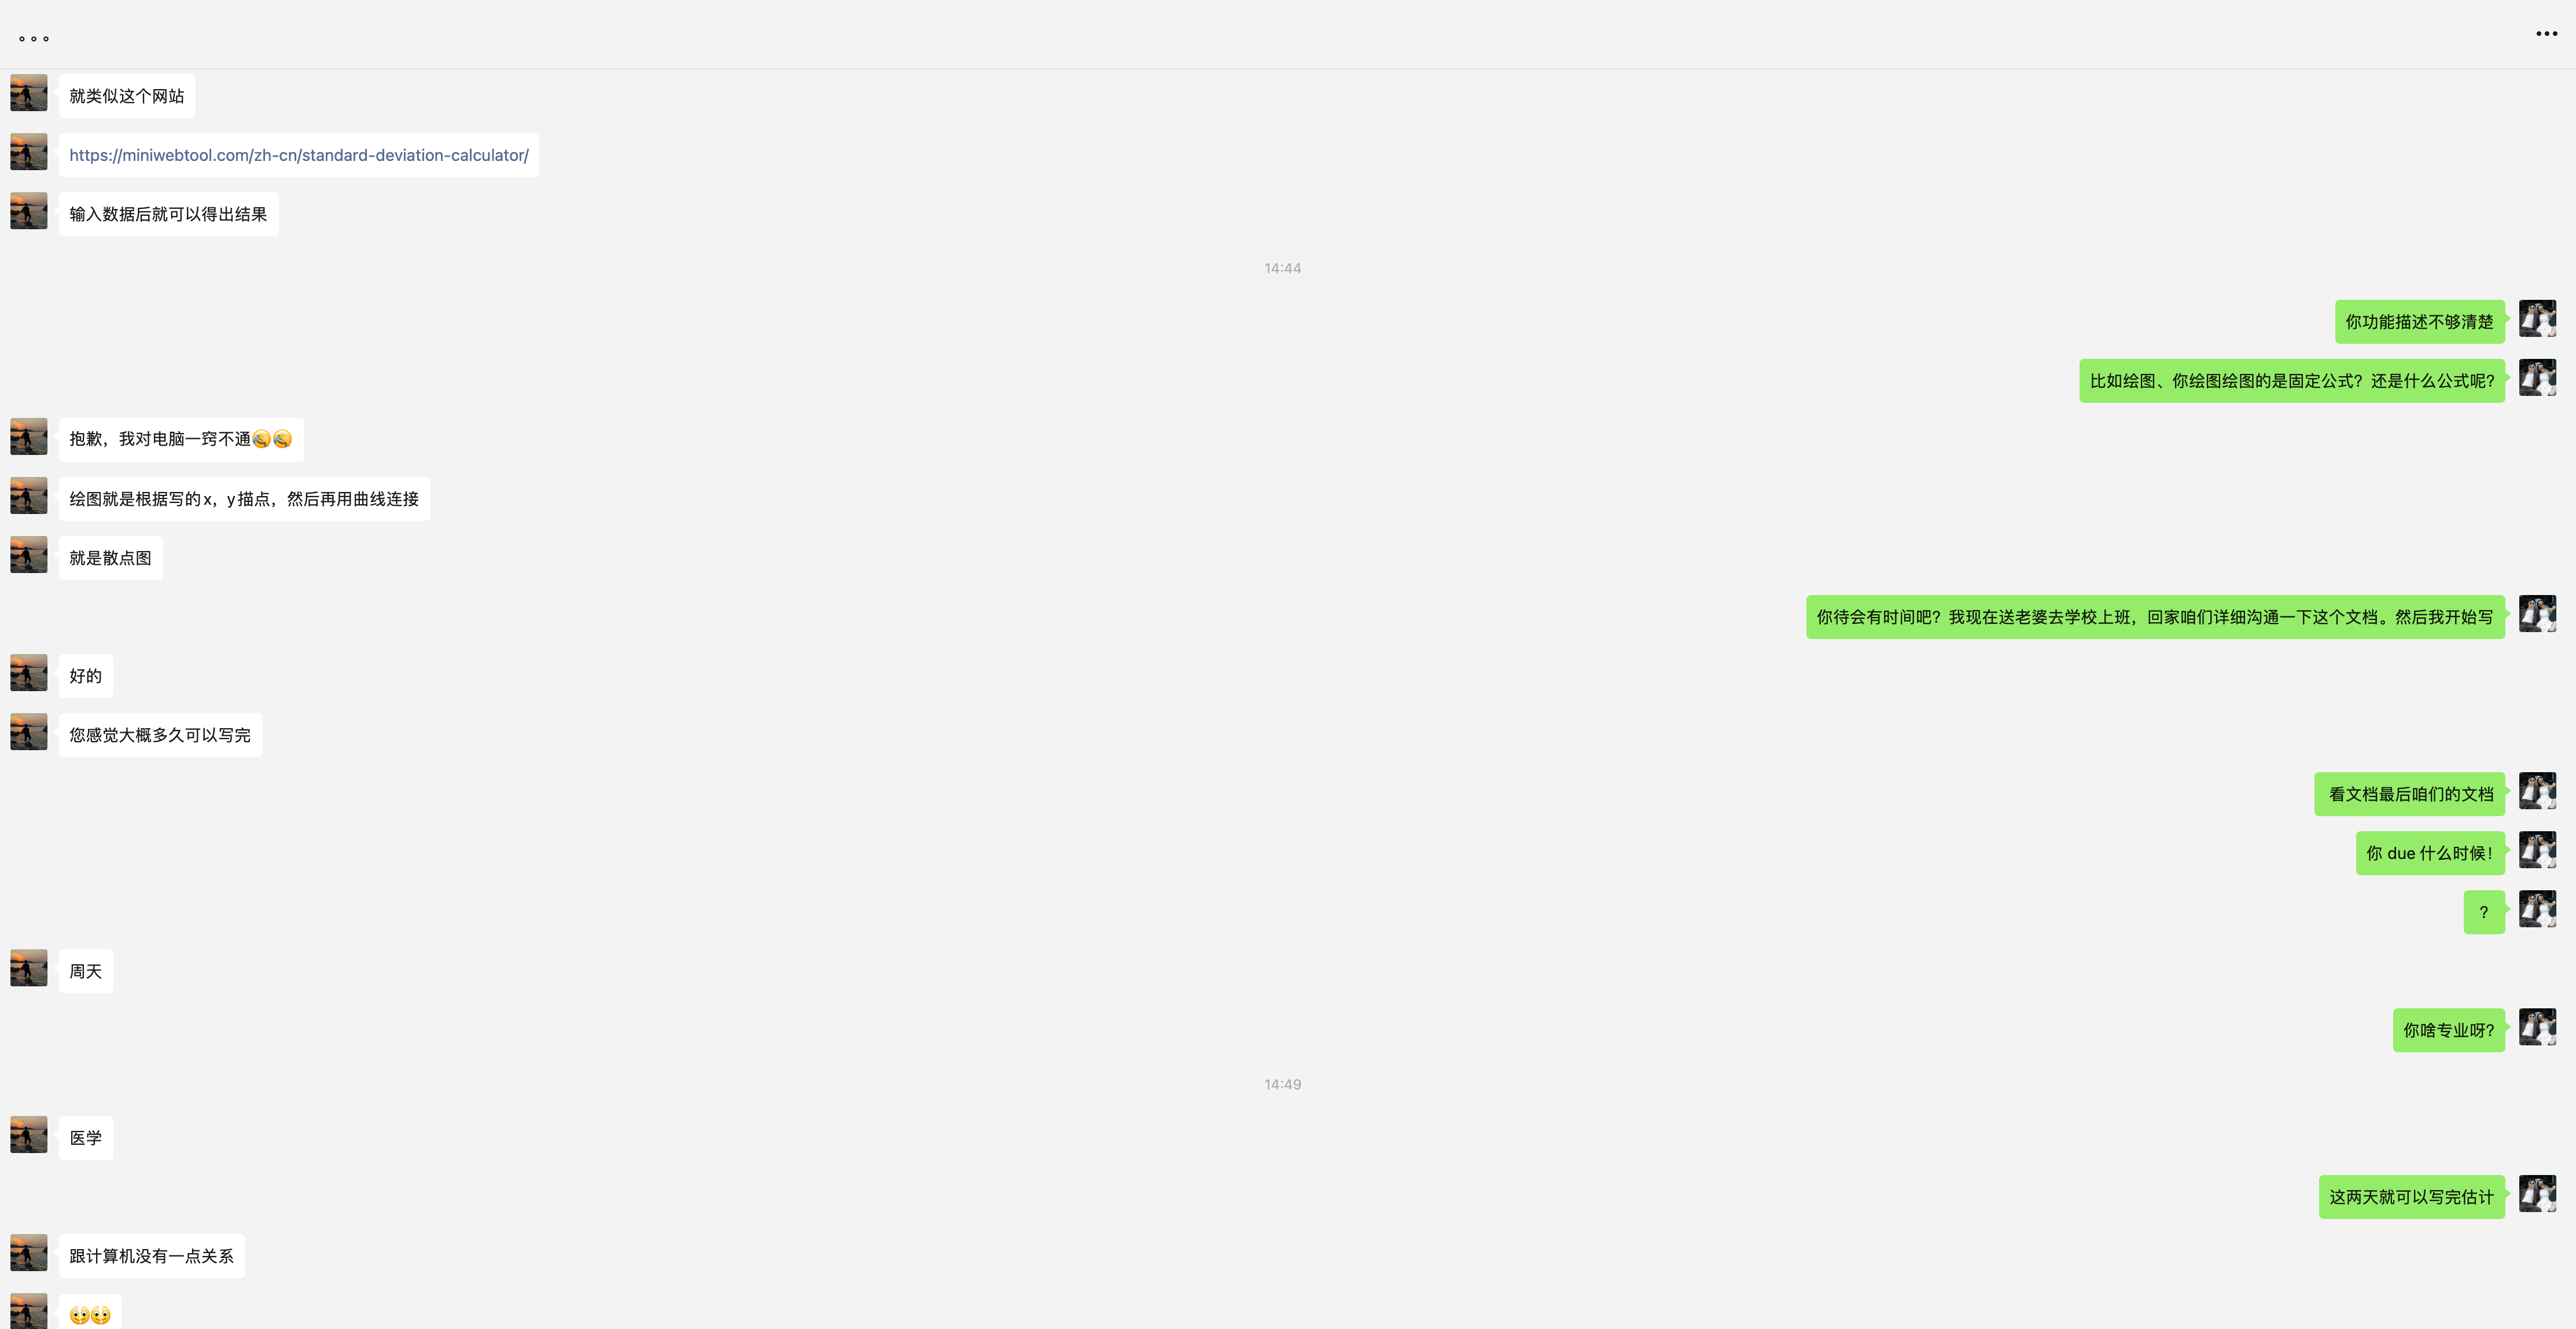
- 点开计算后,提供一个可输入数据的窗口,输入数据并点确定后,可以计算出平均数、方差、RS、RSD;
- 示例:
输入格式:
26 35 42 36 45 25.3 32.16输出:
计算结果如下:

- 平均数 (Mean):34.49
- 方差 (Variance):47.34
- RS (Relative Spread):0.571
- RSD (Relative Standard Deviation):19.95%
绘图:
- 点开绘图后,提供一个可输入 x 轴,y 轴数据的窗口(x、y数量由用户按“+”定义格数),输入后点确定,可以得到一张点线图,线条需要平滑;
2. 代码实现
import tkinter as tk
from tkinter import simpledialog, messagebox
import numpy as np
import matplotlib.pyplot as plt
from scipy.stats import linregress


class DataAnalysisApp:
    def __init__(self, root):
        self.root = root
        self.root.title("实验数据分析")
        self.create_widgets()

    def create_widgets(self):
        self.calc_button = tk.Button(self.root, text="计算", command=self.calculate)
        self.calc_button.pack(pady=10)

        self.plot_button = tk.Button(self.root, text="绘图", command=self.plot)
        self.plot_button.pack(pady=10)

    def calculate(self):
        data_str = simpledialog.askstring("输入数据", "请输入数据(用空格分隔):")
        if data_str:
            try:
                data = list(map(float, data_str.split()))
                mean = np.mean(data)
                variance = np.var(data)
                rs = (np.max(data) - np.min(data)) / mean
                rsd = (np.std(data) / mean) * 100

                result = f"计算结果如下:\n\n- 平均数 (Mean):{mean:.2f}\n- 方差 (Variance):{variance:.2f}\n- RS (Relative Spread):{rs:.3f}\n- RSD (Relative Standard Deviation):{rsd:.2f}%"
                messagebox.showinfo("计算结果", result)
            except Exception as e:
                messagebox.showerror("错误", f"数据格式错误:{e}")

    def plot(self):
        num_points = simpledialog.askinteger("输入点数", "请输入数据点的数量:")
        if num_points and num_points > 0:
            x_data = []
            y_data = []
            for i in range(num_points):
                x = simpledialog.askfloat("输入 X 轴数据", f"请输入第 {i + 1} 个 X 轴数据:")
                y = simpledialog.askfloat("输入 Y 轴数据", f"请输入第 {i + 1} 个 Y 轴数据:")
                if x is not None and y is not None:
                    x_data.append(x)
                    y_data.append(y)
                else:
                    messagebox.showerror("错误", "数据输入有误,请重新输入。")
                    return

            plt.figure()
            plt.plot(x_data, y_data, 'bo-', label='Data')
            slope, intercept, r_value, p_value, std_err = linregress(x_data, y_data)
            plt.plot(x_data, intercept + slope * np.array(x_data), 'r',
                     label=f'Fit line (y={slope:.2f}x+{intercept:.2f})')
            plt.xlabel('X 轴')
            plt.ylabel('Y 轴')
            plt.title('点线图及线性拟合')
            plt.legend()
            plt.show()


if __name__ == "__main__":
    root = tk.Tk()
    app = DataAnalysisApp(root)
root.mainloop()import tkinter as tk
from tkinter import simpledialog, messagebox
import numpy as np
import matplotlib.pyplot as plt
from scipy.stats import linregress
class DataAnalysisApp:
def __init__(self, root):
self.root = root
self.root.title("实验数据分析")
self.create_widgets()
def create_widgets(self):
self.calc_button = tk.Button(self.root, text="计算", command=self.calculate)
self.calc_button.pack(pady=10)
self.plot_button = tk.Button(self.root, text="绘图", command=self.plot)
self.plot_button.pack(pady=10)
def calculate(self):
self.calc_window = tk.Toplevel(self.root)
self.calc_window.title("输入数据")
self.input_label = tk.Label(self.calc_window, text="请输入数据(用空格分隔):")
self.input_label.pack(pady=5)
self.data_entry = tk.Entry(self.calc_window, width=50)
self.data_entry.pack(pady=5)
self.submit_button = tk.Button(self.calc_window, text="确定", command=self.perform_calculation)
self.submit_button.pack(pady=10)
self.result_label = tk.Label(self.calc_window, text="", justify=tk.LEFT)
self.result_label.pack(pady=10)
def perform_calculation(self):
data_str = self.data_entry.get()
if data_str:
try:
data = list(map(float, data_str.split()))
mean = np.mean(data)
variance = np.var(data)
rs = (np.max(data) - np.min(data)) / mean
rsd = (np.std(data) / mean) * 100
result = f"计算结果如下:\n\n- 平均数 (Mean):{mean:.2f}\n- 方差 (Variance):{variance:.2f}\n- RS (Relative Spread):{rs:.3f}\n- RSD (Relative Standard Deviation):{rsd:.2f}%"
self.result_label.config(text=result)
except Exception as e:
self.result_label.config(text=f"数据格式错误:{e}")
def plot(self):
num_points = simpledialog.askinteger("输入点数", "请输入数据点的数量:")
if num_points and num_points > 0:
x_data = []
y_data = []
for i in range(num_points):
x = simpledialog.askfloat("输入 X 轴数据", f"请输入第 {i + 1} 个 X 轴数据:")
y = simpledialog.askfloat("输入 Y 轴数据", f"请输入第 {i + 1} 个 Y 轴数据:")
if x is not None and y is not None:
x_data.append(x)
y_data.append(y)
else:
messagebox.showerror("错误", "数据输入有误,请重新输入。")
return
plt.figure()
plt.plot(x_data, y_data, 'bo-', label='Data')
slope, intercept, r_value, p_value, std_err = linregress(x_data, y_data)
plt.plot(x_data, intercept + slope * np.array(x_data), 'r', label=f'Fit line (y={slope:.2f}x+{intercept:.2f})')
plt.xlabel('X 轴')
plt.ylabel('Y 轴')
plt.title('点线图及线性拟合')
plt.legend()
plt.show()
if __name__ == "__main__":
root = tk.Tk()
app = DataAnalysisApp(root)
root.mainloop()import tkinter as tk
from tkinter import simpledialog, messagebox
import numpy as np
import matplotlib.pyplot as plt
from scipy.stats import linregress
from matplotlib.backends.backend_tkagg import FigureCanvasTkAgg
class DataAnalysisApp:
def __init__(self, root):
self.root = root
self.root.title("实验数据分析")
# 设置窗口的大小 (宽度x高度)
self.root.geometry("180x100") # 例如,将窗口设置为800x600像素
self.create_widgets()
def create_widgets(self):
self.calc_button = tk.Button(self.root, text="计算", command=self.calculate)
self.calc_button.pack(pady=10)
self.plot_button = tk.Button(self.root, text="绘图", command=self.plot)
self.plot_button.pack(pady=10)
def calculate(self):
self.calc_window = tk.Toplevel(self.root)
self.calc_window.title("输入数据")
self.input_label = tk.Label(self.calc_window, text="请输入数据(用空格分隔):")
self.input_label.pack(pady=5)
self.data_entry = tk.Entry(self.calc_window, width=50)
self.data_entry.pack(pady=5)
self.submit_button = tk.Button(self.calc_window, text="确定", command=self.perform_calculation)
self.submit_button.pack(pady=10)
self.result_label = tk.Label(self.calc_window, text="", justify=tk.LEFT)
self.result_label.pack(pady=10)
def perform_calculation(self):
data_str = self.data_entry.get()
if data_str:
try:
data = list(map(float, data_str.split()))
mean = np.mean(data)
variance = np.var(data)
rs = (np.max(data) - np.min(data)) / mean
rsd = (np.std(data) / mean) * 100
result = f"计算结果如下:\n\n- 平均数 (Mean):{mean:.2f}\n- 方差 (Variance):{variance:.2f}\n- RS (Relative Spread):{rs:.3f}\n- RSD (Relative Standard Deviation):{rsd:.2f}%"
self.result_label.config(text=result)
except Exception as e:
self.result_label.config(text=f"数据格式错误:{e}")
def plot(self):
self.plot_window = tk.Toplevel(self.root)
self.plot_window.title("输入数据")
self.input_label = tk.Label(self.plot_window, text="请输入数据(格式:[(x1, y1), (x2, y2),... (xn, yn)]):")
self.input_label.pack(pady=5)
self.data_entry = tk.Entry(self.plot_window, width=50)
self.data_entry.pack(pady=5)
self.submit_button = tk.Button(self.plot_window, text="确定", command=self.perform_plot)
self.submit_button.pack(pady=10)
self.canvas = None
def perform_plot(self):
data_str = self.data_entry.get()
if data_str:
try:
data = eval(data_str)
x_data, y_data = zip(*data)
fig, ax = plt.subplots()
ax.plot(x_data, y_data, 'bo-', label='Data')
slope, intercept, r_value, p_value, std_err = linregress(x_data, y_data)
ax.plot(x_data, intercept + slope * np.array(x_data), 'r',
label=f'Fit line (y={slope:.2f}x+{intercept:.2f})')
ax.set_xlabel('X 轴')
ax.set_ylabel('Y 轴')
ax.set_title('点线图及线性拟合')
ax.legend()
if self.canvas:
self.canvas.get_tk_widget().pack_forget()
self.canvas = FigureCanvasTkAgg(fig, master=self.plot_window)
self.canvas.draw()
self.canvas.get_tk_widget().pack()
except Exception as e:
messagebox.showerror("错误", f"数据格式错误:{e}")
if __name__ == "__main__":
root = tk.Tk()
app = DataAnalysisApp(root)
root.mainloop()import tkinter as tk
from tkinter import simpledialog, messagebox
import numpy as np
import matplotlib.pyplot as plt
from scipy.stats import linregress
from matplotlib.backends.backend_tkagg import FigureCanvasTkAgg
class DataAnalysisApp:
def __init__(self, root):
self.root = root
self.root.title("实验数据分析")
self.create_widgets()
def create_widgets(self):
self.calc_button = tk.Button(self.root, text="计算", command=self.calculate)
self.calc_button.pack(pady=10)
self.plot_button = tk.Button(self.root, text="绘图", command=self.plot)
self.plot_button.pack(pady=10)
def calculate(self):
self.calc_window = tk.Toplevel(self.root)
self.calc_window.title("输入数据")
self.input_label = tk.Label(self.calc_window, text="请输入数据(用空格分隔):")
self.input_label.pack(pady=5)
self.data_entry = tk.Entry(self.calc_window, width=50)
self.data_entry.pack(pady=5)
self.submit_button = tk.Button(self.calc_window, text="确定", command=self.perform_calculation)
self.submit_button.pack(pady=10)
self.result_label = tk.Label(self.calc_window, text="", justify=tk.LEFT)
self.result_label.pack(pady=10)
def perform_calculation(self):
data_str = self.data_entry.get()
if data_str:
try:
data = list(map(float, data_str.split()))
mean = np.mean(data)
variance = np.var(data)
rs = (np.max(data) - np.min(data)) / mean
rsd = (np.std(data) / mean) * 100
result = f"计算结果如下:\n\n- 平均数 (Mean):{mean:.2f}\n- 方差 (Variance):{variance:.2f}\n- RS (Relative Spread):{rs:.3f}\n- RSD (Relative Standard Deviation):{rsd:.2f}%"
self.result_label.config(text=result)
except Exception as e:
self.result_label.config(text=f"数据格式错误:{e}")
def plot(self):
self.plot_window = tk.Toplevel(self.root)
self.plot_window.title("输入数据")
self.input_label = tk.Label(self.plot_window, text="请输入数据(格式:[(x1, y1), (x2, y2),... (xn, yn)]):")
self.input_label.pack(pady=5)
self.data_entry = tk.Entry(self.plot_window, width=50)
self.data_entry.pack(pady=5)
self.title_label = tk.Label(self.plot_window, text="绘图标题:")
self.title_label.pack(pady=5)
self.title_entry = tk.Entry(self.plot_window, width=50)
self.title_entry.pack(pady=5)
self.xlabel_label = tk.Label(self.plot_window, text="X 轴名称:")
self.xlabel_label.pack(pady=5)
self.xlabel_entry = tk.Entry(self.plot_window, width=50)
self.xlabel_entry.pack(pady=5)
self.ylabel_label = tk.Label(self.plot_window, text="Y 轴名称:")
self.ylabel_label.pack(pady=5)
self.ylabel_entry = tk.Entry(self.plot_window, width=50)
self.ylabel_entry.pack(pady=5)
self.submit_button = tk.Button(self.plot_window, text="确定", command=self.perform_plot)
self.submit_button.pack(pady=10)
self.canvas = None
def perform_plot(self):
data_str = self.data_entry.get()
plot_title = self.title_entry.get()
x_label = self.xlabel_entry.get()
y_label = self.ylabel_entry.get()
if data_str:
try:
data = eval(data_str)
x_data, y_data = zip(*data)
fig, ax = plt.subplots()
ax.plot(x_data, y_data, 'bo-', label='Data')
slope, intercept, r_value, p_value, std_err = linregress(x_data, y_data)
ax.plot(x_data, intercept + slope * np.array(x_data), 'r', label=f'Fit line (y={slope:.2f}x+{intercept:.2f})')
ax.set_xlabel(x_label)
ax.set_ylabel(y_label)
ax.set_title(plot_title)
ax.legend()
if self.canvas:
self.canvas.get_tk_widget().pack_forget()
self.canvas = FigureCanvasTkAgg(fig, master=self.plot_window)
self.canvas.draw()
self.canvas.get_tk_widget().pack()
except Exception as e:
messagebox.showerror("错误", f"数据格式错误:{e}")
if __name__ == "__main__":
root = tk.Tk()
app = DataAnalysisApp(root)
root.mainloop()import tkinter as tk
from tkinter import simpledialog, messagebox
import numpy as np
import matplotlib.pyplot as plt
from scipy.stats import linregress
from matplotlib.backends.backend_tkagg import FigureCanvasTkAgg
class DataAnalysisApp:
def __init__(self, root):
# 初始化应用程序
self.root = root
self.root.title("实验数据分析") # 设置主窗口标题
self.create_widgets() # 创建主界面的按钮
def create_widgets(self):
# 创建计算按钮
self.calc_button = tk.Button(self.root, text="计算", command=self.calculate)
self.calc_button.pack(pady=10)
# 创建绘图按钮
self.plot_button = tk.Button(self.root, text="绘图", command=self.plot)
self.plot_button.pack(pady=10)
def calculate(self):
# 创建计算数据的输入窗口
self.calc_window = tk.Toplevel(self.root)
self.calc_window.title("输入数据")
# 输入数据的标签和输入框
self.input_label = tk.Label(self.calc_window, text="请输入数据(用空格分隔):")
self.input_label.pack(pady=5)
self.data_entry = tk.Entry(self.calc_window, width=50)
self.data_entry.pack(pady=5)
# 提交按钮
self.submit_button = tk.Button(self.calc_window, text="确定", command=self.perform_calculation)
self.submit_button.pack(pady=10)
# 显示计算结果的标签
self.result_label = tk.Label(self.calc_window, text="", justify=tk.LEFT)
self.result_label.pack(pady=10)
def perform_calculation(self):
# 执行计算操作
data_str = self.data_entry.get() # 获取用户输入的数据
if data_str:
try:
# 将输入的字符串转换为浮点数列表
data = list(map(float, data_str.split()))
# 计算平均数、方差、相对扩展系数和相对标准偏差
mean = np.mean(data)
variance = np.var(data)
rs = (np.max(data) - np.min(data)) / mean
rsd = (np.std(data) / mean) * 100
# 构建结果字符串
result = f"计算结果如下:\n\n- 平均数 (Mean):{mean:.2f}\n- 方差 (Variance):{variance:.2f}\n- RS (Relative Spread):{rs:.3f}\n- RSD (Relative Standard Deviation):{rsd:.2f}%"
self.result_label.config(text=result) # 显示计算结果
except Exception as e:
# 数据格式错误处理
self.result_label.config(text=f"数据格式错误:{e}")
def plot(self):
# 创建绘图数据的输入窗口
self.plot_window = tk.Toplevel(self.root)
self.plot_window.title("输入数据")
# 输入数据格式的标签和输入框
self.input_label = tk.Label(self.plot_window, text="请输入数据(格式:[(x1, y1), (x2, y2),... (xn, yn)]):")
self.input_label.pack(pady=5)
self.data_entry = tk.Entry(self.plot_window, width=50)
self.data_entry.pack(pady=5)
# 输入绘图标题的标签和输入框
self.title_label = tk.Label(self.plot_window, text="绘图标题:")
self.title_label.pack(pady=5)
self.title_entry = tk.Entry(self.plot_window, width=50)
self.title_entry.pack(pady=5)
# 输入X轴名称的标签和输入框
self.xlabel_label = tk.Label(self.plot_window, text="X 轴名称:")
self.xlabel_label.pack(pady=5)
self.xlabel_entry = tk.Entry(self.plot_window, width=50)
self.xlabel_entry.pack(pady=5)
# 输入Y轴名称的标签和输入框
self.ylabel_label = tk.Label(self.plot_window, text="Y 轴名称:")
self.ylabel_label.pack(pady=5)
self.ylabel_entry = tk.Entry(self.plot_window, width=50)
self.ylabel_entry.pack(pady=5)
# 提交按钮
self.submit_button = tk.Button(self.plot_window, text="确定", command=self.perform_plot)
self.submit_button.pack(pady=10)
self.canvas = None # 初始化画布为空
def perform_plot(self):
# 执行绘图操作
data_str = self.data_entry.get() # 获取用户输入的数据
plot_title = self.title_entry.get() # 获取用户输入的绘图标题
x_label = self.xlabel_entry.get() # 获取用户输入的X轴名称
y_label = self.ylabel_entry.get() # 获取用户输入的Y轴名称
if data_str:
try:
# 解析输入的数据
data = eval(data_str)
x_data, y_data = zip(*data)
# 创建绘图
fig, ax = plt.subplots()
ax.plot(x_data, y_data, 'bo-', label='Data')
slope, intercept, r_value, p_value, std_err = linregress(x_data, y_data)
ax.plot(x_data, intercept + slope * np.array(x_data), 'r', label=f'Fit line (y={slope:.2f}x+{intercept:.2f})')
ax.set_xlabel(x_label) # 设置X轴名称
ax.set_ylabel(y_label) # 设置Y轴名称
ax.set_title(plot_title) # 设置绘图标题
ax.legend()
# 如果已有画布,移除旧的画布
if self.canvas:
self.canvas.get_tk_widget().pack_forget()
# 将图形嵌入Tkinter窗口中
self.canvas = FigureCanvasTkAgg(fig, master=self.plot_window)
self.canvas.draw()
self.canvas.get_tk_widget().pack()
except Exception as e:
# 数据格式错误处理
messagebox.showerror("错误", f"数据格式错误:{e}")
if __name__ == "__main__":
root = tk.Tk()
app = DataAnalysisApp(root)
root.mainloop()Python计算:26 35 42 36 45 25.3 32.16,计算出平均数、方差、RS、RSD
详情
实验数据分析程序教程
本教程将逐步带领您编写一个实验数据分析程序,使用 Tkinter 创建图形用户界面 (GUI),进行数据的计算和绘图。我们将从基础功能开始,逐步优化和扩展该程序。
第一步:创建主窗口和按钮
首先,我们创建一个基本的 Tkinter 窗口,并在窗口中添加两个按钮:“计算”和“绘图”。
import tkinter as tk

class DataAnalysisApp:
    def __init__(self, root):
        self.root = root
        self.root.title("实验数据分析")
        self.create_widgets()

    def create_widgets(self):
        self.calc_button = tk.Button(self.root, text="计算", command=self.calculate)
        self.calc_button.pack(pady=10)

        self.plot_button = tk.Button(self.root, text="绘图", command=self.plot)
        self.plot_button.pack(pady=10)

    def calculate(self):
        pass

    def plot(self):
        pass

if __name__ == "__main__":
    root = tk.Tk()
    app = DataAnalysisApp(root)
    root.mainloop()
在 create_widgets 方法中,我们创建了两个按钮,并将它们添加到主窗口中。
第二步:实现计算功能
接下来,我们实现“计算”按钮的功能。点击按钮后,会弹出一个新窗口,让用户输入数据,并计算平均数、方差、相对分散 (RS) 和相对标准差 (RSD)。
import numpy as np

def calculate(self):
    self.calc_window = tk.Toplevel(self.root)
    self.calc_window.title("输入数据")

    self.input_label = tk.Label(self.calc_window, text="请输入数据(用空格分隔):")
    self.input_label.pack(pady=5)

    self.data_entry = tk.Entry(self.calc_window, width=50)
    self.data_entry.pack(pady=5)

    self.submit_button = tk.Button(self.calc_window, text="确定", command=self.perform_calculation)
    self.submit_button.pack(pady=10)

    self.result_label = tk.Label(self.calc_window, text="", justify=tk.LEFT)
    self.result_label.pack(pady=10)

def perform_calculation(self):
    data_str = self.data_entry.get()
    if data_str:
        try:
            data = list(map(float, data_str.split()))
            mean = np.mean(data)
            variance = np.var(data)
            rs = (np.max(data) - np.min(data)) / mean
            rsd = (np.std(data) / mean) * 100

            result = f"计算结果如下:\n\n- 平均数 (Mean):{mean:.2f}\n- 方差 (Variance):{variance:.2f}\n- RS (Relative Spread):{rs:.3f}\n- RSD (Relative Standard Deviation):{rsd:.2f}%"
            self.result_label.config(text=result)
        except Exception as e:
            self.result_label.config(text=f"数据格式错误:{e}")
在 calculate 方法中,我们创建了一个新窗口,用户可以在其中输入数据。输入完成后,点击“确定”按钮会调用 perform_calculation 方法,计算并显示结果。
第三步:实现绘图功能
现在,我们实现“绘图”按钮的功能。点击按钮后,会弹出一个新窗口,用户可以输入数据,绘制图形并显示在窗口中。
import matplotlib.pyplot as plt
from matplotlib.backends.backend_tkagg import FigureCanvasTkAgg
from scipy.stats import linregress

def plot(self):
    self.plot_window = tk.Toplevel(self.root)
    self.plot_window.title("输入数据")

    self.input_label = tk.Label(self.plot_window, text="请输入数据(格式:[(x1, y1), (x2, y2),... (xn, yn)]):")
    self.input_label.pack(pady=5)

    self.data_entry = tk.Entry(self.plot_window, width=50)
    self.data_entry.pack(pady=5)

    self.title_label = tk.Label(self.plot_window, text="绘图标题:")
    self.title_label.pack(pady=5)
    self.title_entry = tk.Entry(self.plot_window, width=50)
    self.title_entry.pack(pady=5)

    self.xlabel_label = tk.Label(self.plot_window, text="X 轴名称:")
    self.xlabel_label.pack(pady=5)
    self.xlabel_entry = tk.Entry(self.plot_window, width=50)
    self.xlabel_entry.pack(pady=5)

    self.ylabel_label = tk.Label(self.plot_window, text="Y 轴名称:")
    self.ylabel_label.pack(pady=5)
    self.ylabel_entry = tk.Entry(self.plot_window, width=50)
    self.ylabel_entry.pack(pady=5)

    self.submit_button = tk.Button(self.plot_window, text="确定", command=self.perform_plot)
    self.submit_button.pack(pady=10)

    self.canvas = None

def perform_plot(self):
    data_str = self.data_entry.get()
    plot_title = self.title_entry.get()
    x_label = self.xlabel_entry.get()
    y_label = self.ylabel_entry.get()
    if data_str:
        try:
            data = eval(data_str)
            x_data, y_data = zip(*data)

            fig, ax = plt.subplots()
            ax.plot(x_data, y_data, 'bo-', label='Data')
            slope, intercept, r_value, p_value, std_err = linregress(x_data, y_data)
            ax.plot(x_data, intercept + slope * np.array(x_data), 'r', label=f'Fit line (y={slope:.2f}x+{intercept:.2f})')
            ax.set_xlabel(x_label)
            ax.set_ylabel(y_label)
            ax.set_title(plot_title)
            ax.legend()

            if self.canvas:
                self.canvas.get_tk_widget().pack_forget()

            self.canvas = FigureCanvasTkAgg(fig, master=self.plot_window)
            self.canvas.draw()
            self.canvas.get_tk_widget().pack()

        except Exception as e:
            messagebox.showerror("错误", f"数据格式错误:{e}")
在 plot 方法中,我们创建了一个新窗口,用户可以在其中输入数据、绘图标题和坐标轴名称。点击“确定”按钮会调用 perform_plot 方法,绘制图形并显示在窗口下方。
最终完整代码
将以上所有代码整合到一起,形成最终的完整代码:
import tkinter as tk
from tkinter import simpledialog, messagebox
import numpy as np
import matplotlib.pyplot as plt
from scipy.stats import linregress
from matplotlib.backends.backend_tkagg import FigureCanvasTkAgg

class DataAnalysisApp:
    def __init__(self, root):
        self.root = root
        self.root.title("实验数据分析")
        self.create_widgets()

    def create_widgets(self):
        self.calc_button = tk.Button(self.root, text="计算", command=self.calculate)
        self.calc_button.pack(pady=10)

        self.plot_button = tk.Button(self.root, text="绘图", command=self.plot)
        self.plot_button.pack(pady=10)

    def calculate(self):
        self.calc_window = tk.Toplevel(self.root)
        self.calc_window.title("输入数据")

        self.input_label = tk.Label(self.calc_window, text="请输入数据(用空格分隔):")
        self.input_label.pack(pady=5)

        self.data_entry = tk.Entry(self.calc_window, width=50)
        self.data_entry.pack(pady=5)

        self.submit_button = tk.Button(self.calc_window, text="确定", command=self.perform_calculation)
        self.submit_button.pack(pady=10)

        self.result_label = tk.Label(self.calc_window, text="", justify=tk.LEFT)
        self.result_label.pack(pady=10)

    def perform_calculation(self):
        data_str = self.data_entry.get()
        if data_str:
            try:
                data = list(map(float, data_str.split()))
                mean = np.mean(data)
                variance = np.var(data)
                rs = (np.max(data) - np.min(data)) / mean
                rsd = (np.std(data) / mean) * 100

                result = f"计算结果如下:\n\n- 平均数 (Mean):{mean:.2f}\n- 方差 (Variance):{variance:.2f}\n- RS (Relative Spread):{rs:.3f}\n- RSD (Relative Standard Deviation):{rsd:.2f}%"
                self.result_label.config(text=result)
            except Exception as e:
                self.result_label.config(text=f"数据格式错误:{e}")

    def plot(self):
        self.plot_window = tk.Toplevel(self.root)
        self.plot_window.title("输入数据")

        self.input_label = tk.Label(self.plot_window, text="请输入数据(格式:[(x1, y1), (x2, y2),... (xn, yn)]):")
        self.input_label.pack(pady=5)

        self.data_entry = tk.Entry(self.plot_window, width=50)
        self.data_entry.pack(pady=5)

        self.title_label = tk.Label(self.plot_window, text="绘图标题:")
        self.title_label.pack(pady=5)
        self.title_entry = tk.Entry(self.plot_window, width=50)
        self.title_entry.pack(pady=5)

        self.xlabel_label = tk.Label(self.plot_window, text="X 轴名称:")
        self.xlabel_label.pack(pady=5)
        self.xlabel

_entry = tk.Entry(self.plot_window, width=50)
        self.xlabel_entry.pack(pady=5)

        self.ylabel_label = tk.Label(self.plot_window, text="Y 轴名称:")
        self.ylabel_label.pack(pady=5)
        self.ylabel_entry = tk.Entry(self.plot_window, width=50)
        self.ylabel_entry.pack(pady=5)

        self.submit_button = tk.Button(self.plot_window, text="确定", command=self.perform_plot)
        self.submit_button.pack(pady=10)

        self.canvas = None

    def perform_plot(self):
        data_str = self.data_entry.get()
        plot_title = self.title_entry.get()
        x_label = self.xlabel_entry.get()
        y_label = self.ylabel_entry.get()
        if data_str:
            try:
                data = eval(data_str)
                x_data, y_data = zip(*data)

                fig, ax = plt.subplots()
                ax.plot(x_data, y_data, 'bo-', label='Data')
                slope, intercept, r_value, p_value, std_err = linregress(x_data, y_data)
                ax.plot(x_data, intercept + slope * np.array(x_data), 'r', label=f'Fit line (y={slope:.2f}x+{intercept:.2f})')
                ax.set_xlabel(x_label)
                ax.set_ylabel(y_label)
                ax.set_title(plot_title)
                ax.legend()

                if self.canvas:
                    self.canvas.get_tk_widget().pack_forget()

                self.canvas = FigureCanvasTkAgg(fig, master=self.plot_window)
                self.canvas.draw()
                self.canvas.get_tk_widget().pack()

            except Exception as e:
                messagebox.showerror("错误", f"数据格式错误:{e}")

if __name__ == "__main__":
    root = tk.Tk()
    app = DataAnalysisApp(root)
    root.mainloop()
通过以上步骤,可以逐步实现一个完整的实验数据分析程序,包括计算和绘图功能,并将绘图结果显示在窗口中。
公众号:AI悦创【二维码】

AI悦创·编程一对一
AI悦创·推出辅导班啦,包括「Python 语言辅导班、C++ 辅导班、java 辅导班、算法/数据结构辅导班、少儿编程、pygame 游戏开发、Web、Linux」,全部都是一对一教学:一对一辅导 + 一对一答疑 + 布置作业 + 项目实践等。当然,还有线下线上摄影课程、Photoshop、Premiere 一对一教学、QQ、微信在线,随时响应!微信:Jiabcdefh
C++ 信息奥赛题解,长期更新!长期招收一对一中小学信息奥赛集训,莆田、厦门地区有机会线下上门,其他地区线上。微信:Jiabcdefh
方法一:QQ
方法二:微信:Jiabcdefh

更新日志
1c35a-于aed17-于de6b1-于4e312-于697cd-于16feb-于67787-于440bb-于02ad2-于1f8b2-于396de-于989b8-于de201-于