
PLEASE INCLUDE YOUR NAME & STUDENT NUMBER ON YOUR DIGITAL EXAM ANSWERS.
PLEASE INCLUDE YOUR NAME & STUDENT NUMBER ON YOUR DIGITAL EXAM ANSWERS.
General Instructions:
- This exam must be completed in your own original words – you may not copy / paste or otherwise reproduce text from any source other than Python output and code. The prohibition on copying material extends to any material that you may have written or assembled prior to the exam (other than code). Copy / pasting material may constitute a departure from academic integrity.
- This exam is a confidential, individual exam. The content of the exam may not be discussed with anyone. Failure to abide by these rules may constitute a departure from academic integrity.
- Data, where required, will be found in the appropriate exam data file which will be shared with this document.
- All analysis and data manipulations should be completed in Python. Submissions can be in Jupyter or Word form.
- Generally, you should include in your submission code and output to document your model where a model is called for. We generally will not be looking at the Python code as part of the grading unless we deem it necessary.
- Answer both questions. The exam should take less than 2 hours to complete. You will have the full 24 hours.
Please save your work often with version control. This will reduce the risk and consequence of a possible technology failure. Extensions will not be provided.
I have recently started an apiary. Currently, I have 4 beehives and understand that each hive can house up to 80,000 bees during the most active part of the season (the summer). Being a data driven beekeeper, I have been keeping track of the health of my hives plus the exogenous factors I believe help or harm the hive. I’ve combined this data with some other data sourced on the internet to ensure I have a large enough sample size for analysis. Use the data on the tab ‘Bees’ to help me understand more about my hive. You can treat the data as representing a single hive over time.
a. Build a model to predict the total number of bees I will have in that hive in any given month. Explain your model building process (2 marks) and paste your final model below (1 mark).
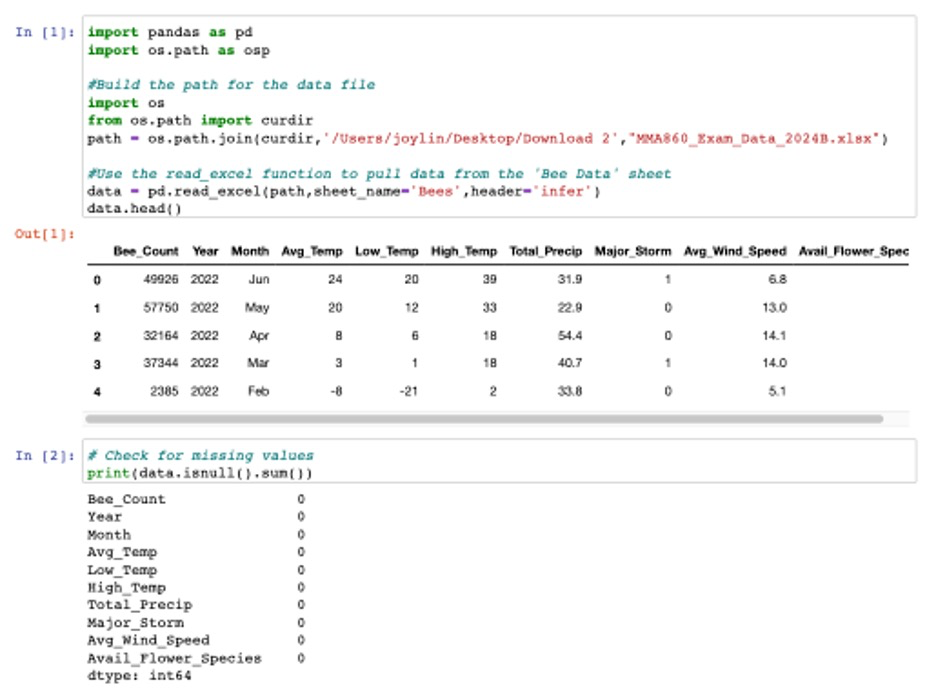
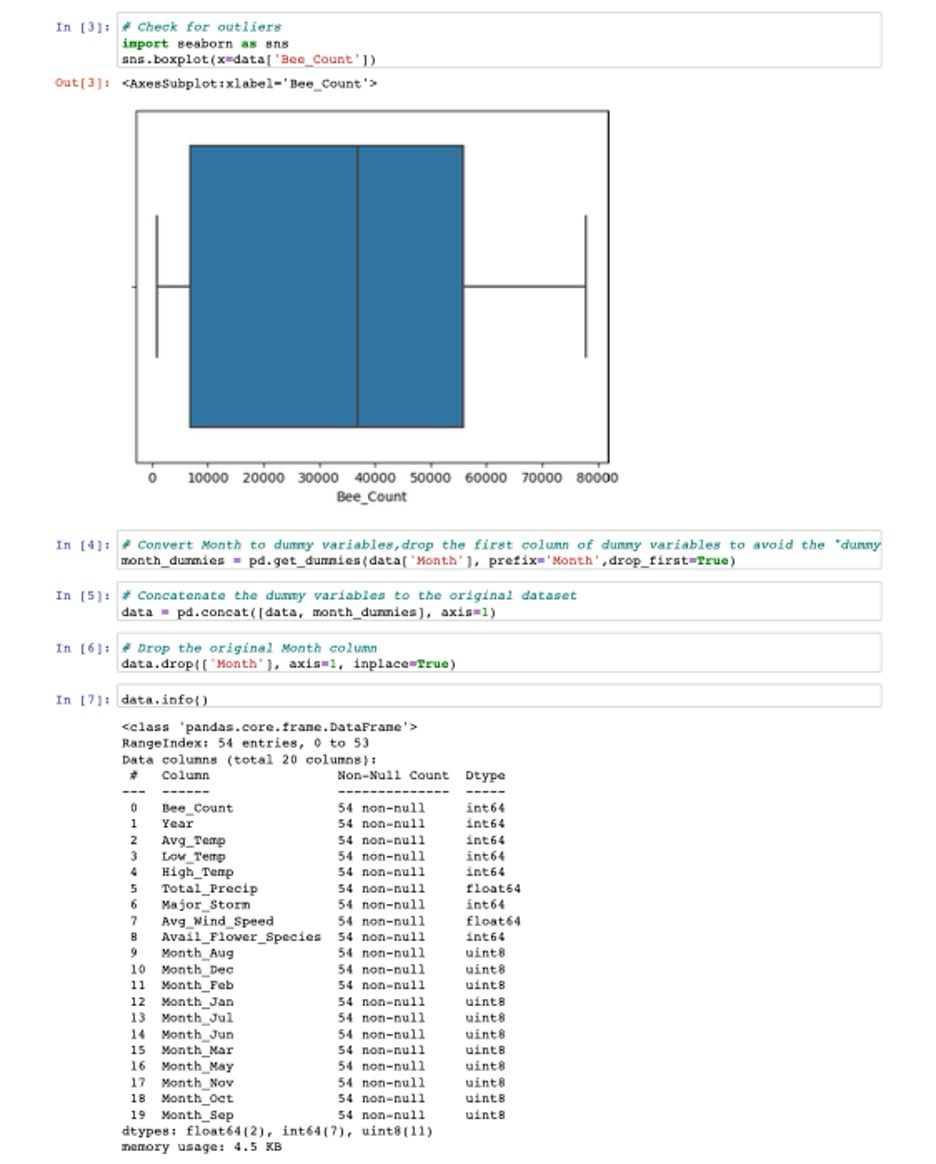
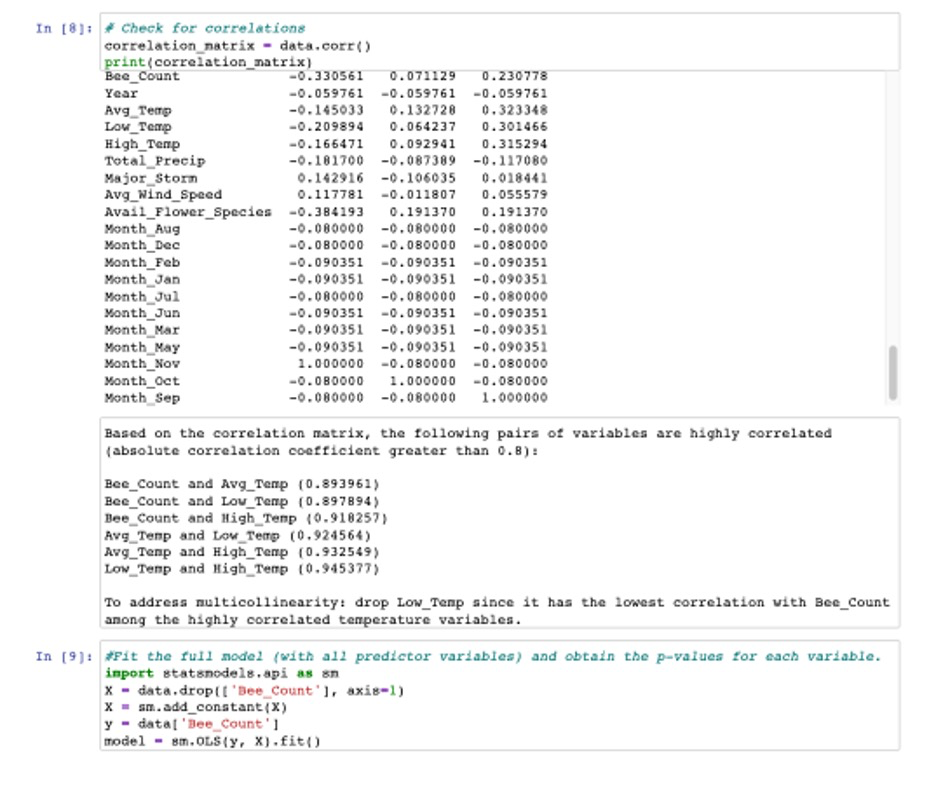
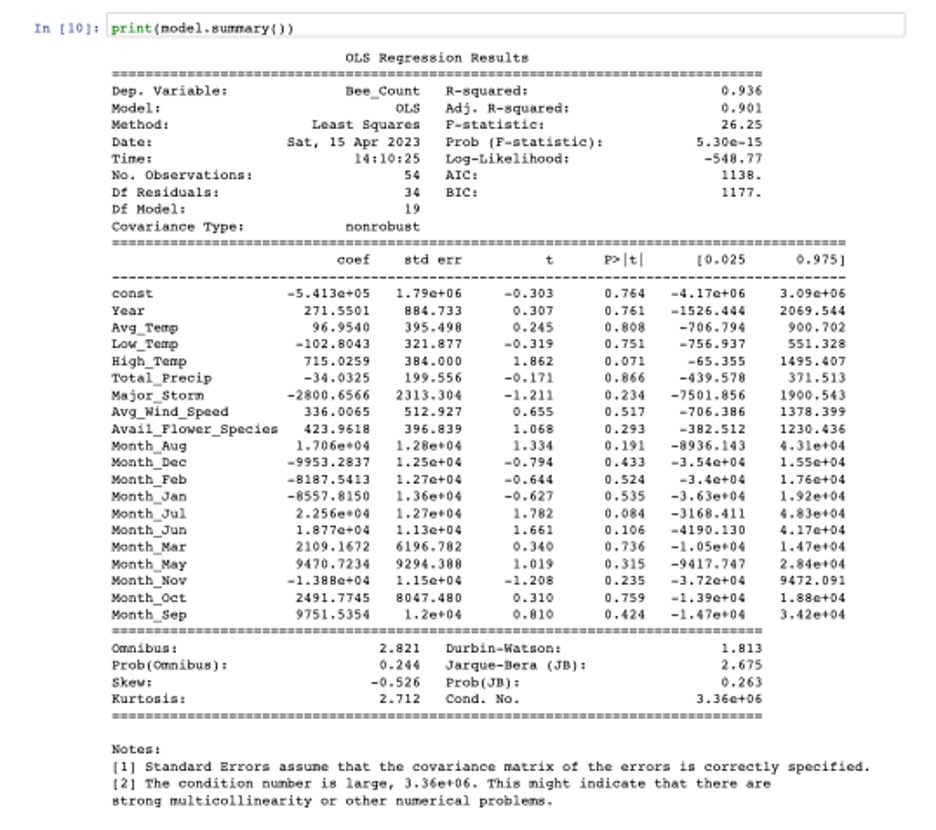
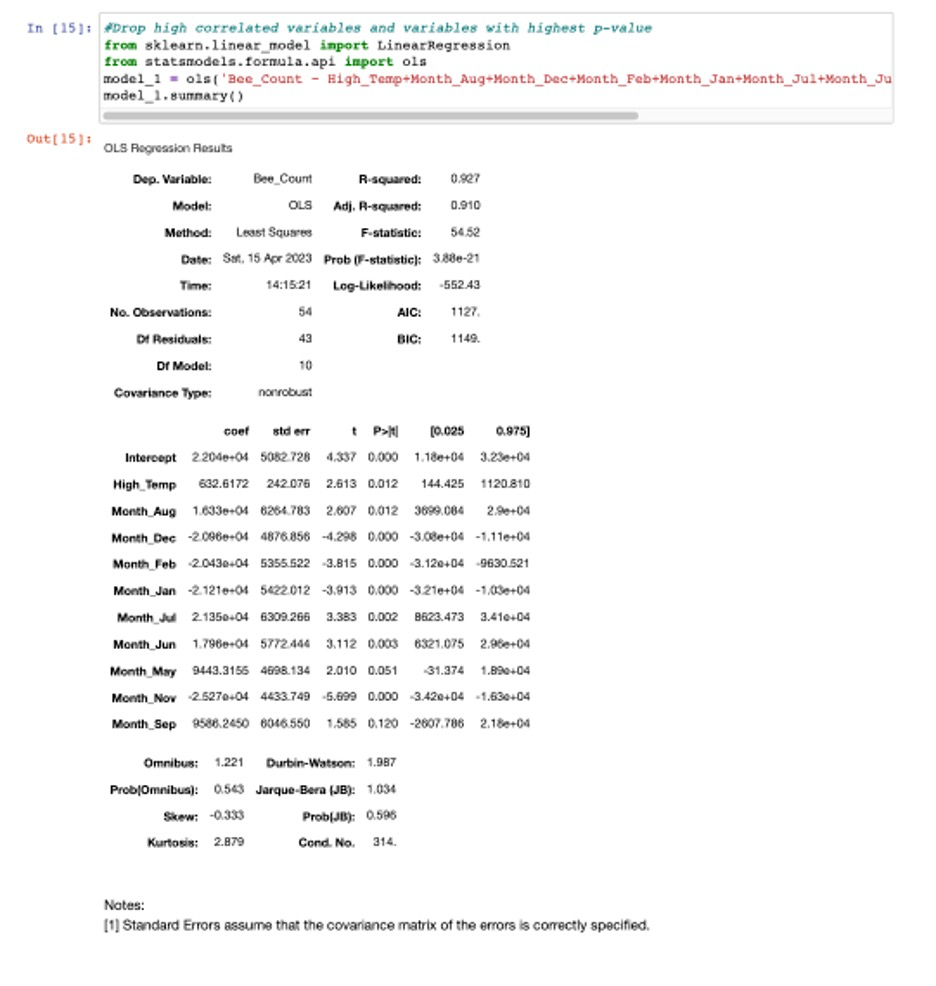
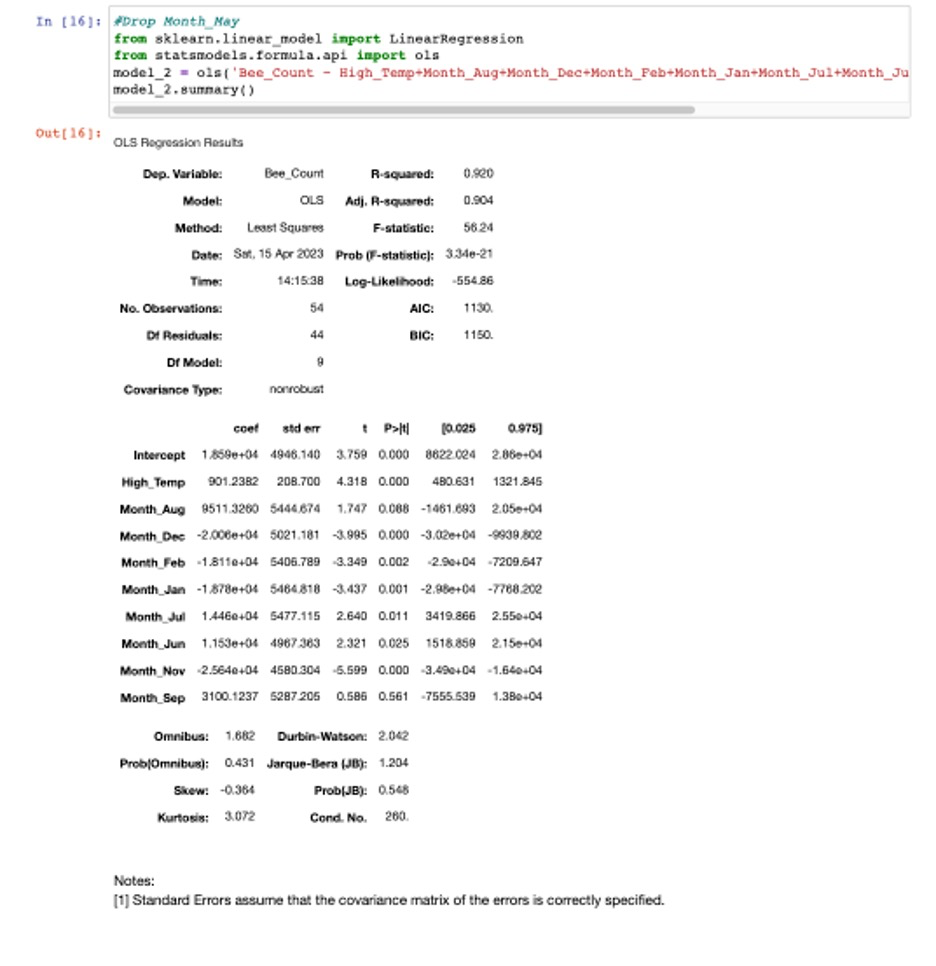
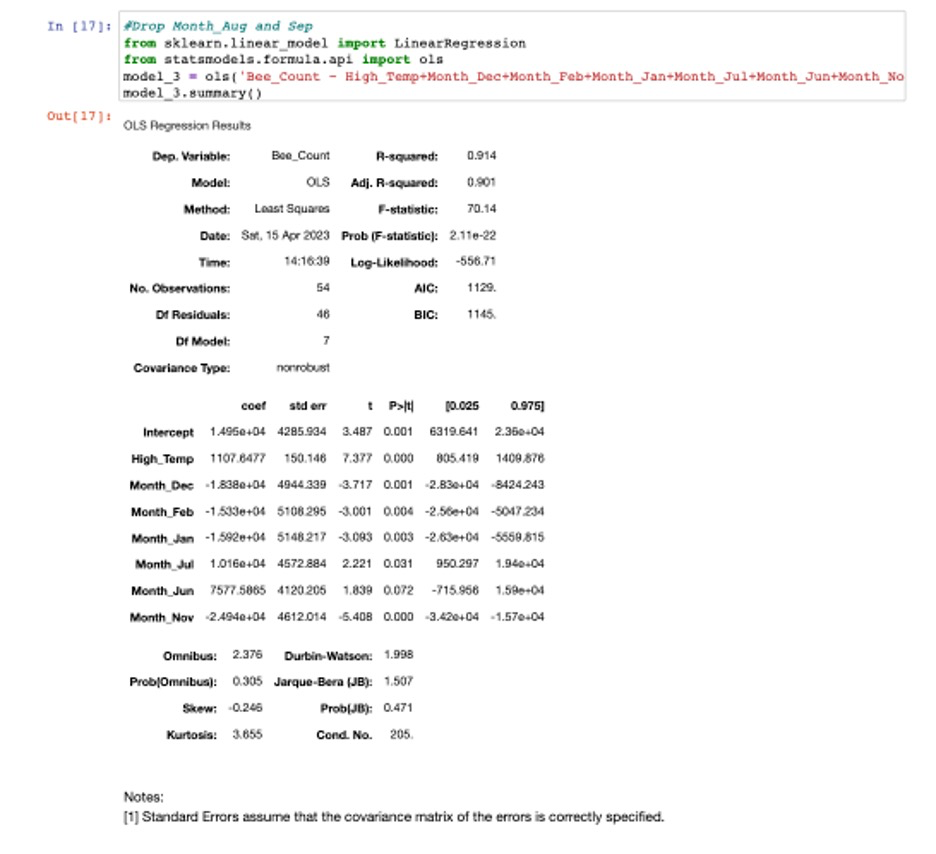
**Answer:**To build a model to predict the total number of bees in your hive in any given month, import the data into a dataframe and run exploratory analysis to understand the dataset, identify for any missing values, and detect any outliers that may need to be addressed. The outputs show looks like there are no missing values and outliers in the data. Convert Month to dummy variables and drop the one column of dummy variables to avoid the dummy variable trap. Create a correlation matrix table to see which variables are strongly correlated with the total number of bees in the hive and also to address multicollinearity. Next, Fit the full model with all predictor variables in the data and check the p-values for each variable. Drop high correlated variables and variables with highest p-value (greater than 0.05) and rerun model summary until all remaining variables have p-values less than 0.05.

b. How do you know this is the best model? (2 marks)
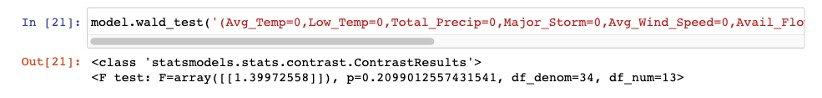
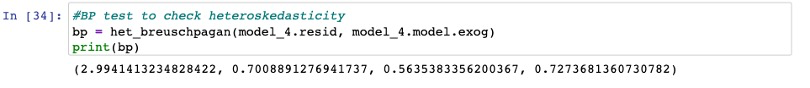
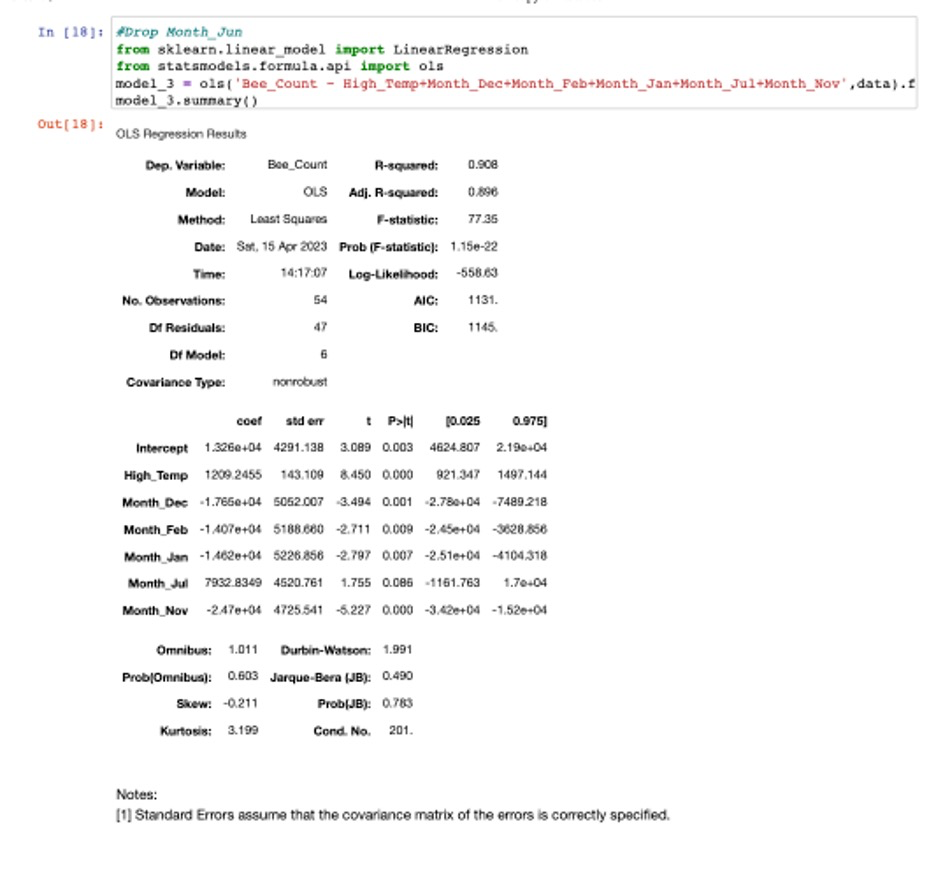
Answer: From the above model summary, the results tell us the model has high R-Sqaured and F-statistic value and all the variables ’p value is less than 0.05, which means the model is a good fit for the data and the variables are all has significant impact on the number of bees. Additionally, the Wald test tells p-value is greater than 0.05, so do not reject the null hypothesis, there is not enough evidence to suggest that they are explanatory variables in the model. BP test’s result also tells the p-value is greater than the significance level (0.05), then fail to reject the null hypothesis – the model is not heteroscedastic. Therefore, this is the best model to predict the total number of bees I will have in that hive in any given month.
c. Does temperature have an impact on the number of bees? Run a formal test. (3 marks)
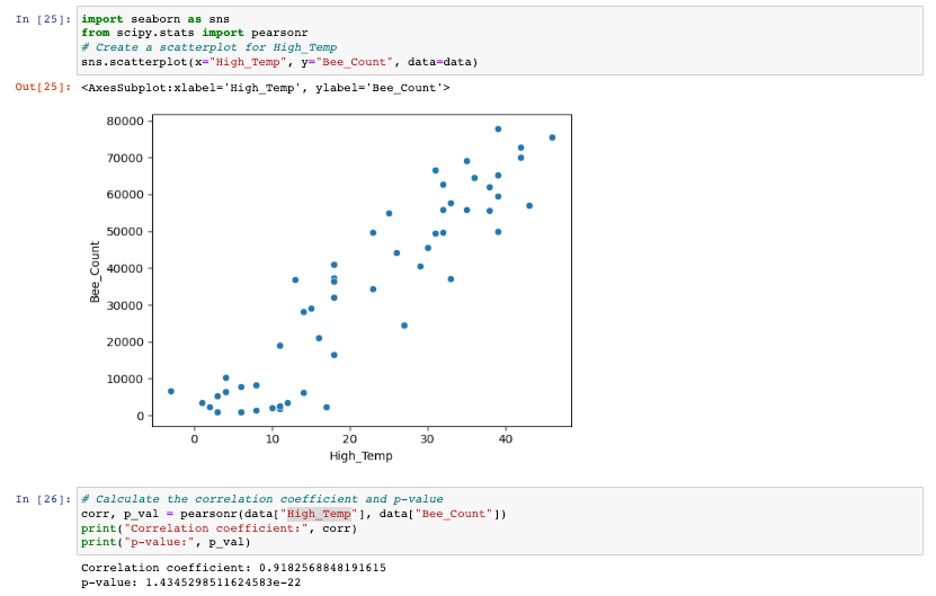
Answer: When building the model, we knew that only HighTemp has significant impact on predicting the total number of bees. Therefore, we can start by creating a scatterplot to visualize the relationship between High__temperature and the total number of bees, and then run a correlation test to measure the strength and direction of the association. Based on the correlation coefficient and p-value, we can conclude that there is a strong positive correlation between temperature and the number of bees. The correlation coefficient of 0.918 suggests that there is a very strong linear relationship between the two variables, and the p-value of 1.4345298511624583e-22 is very small, indicating that the correlation is significant and unlikely to be due to chance. Therefore, we can infer that temperature does have an impact on the number of bees. Additionally, we can use a scatterplot to visualize the relationship between High_ temp and the number of bees, we can find from the scatterplot that temperature has a positive impact on the number of bees.
d. If the total number of bees ever goes beyond 95,000, the hive will swarm. Yes, this is a real thing, and yes, it is terrifying. Use the data on the tab ‘
Next_Season’ to predict the size of the beehive in each month of the next season. The data is sourced directly from the Farmer’s Almanac. Should I be worried about swarming if the forecasted weather is correct? Why or why not? (4 marks)Answer: The size of the beehive in each month of the next season will not exceed 95,000 as per the predicted bee count result below. Suppose the forecasted weather includes high temperatures (which have a positive coefficient in the model per final model summary) and the months of December, February, January, and November (which have negative coefficients per final model summary). In that case, the predicted bee count should be lower than average. As the previous question mentioned, the temperature positively impacts the number of bees. However, the months significantly impacting the number of bees tend to have a lower temperature. Other variables related to weather: major storms, and average wind, do not significantly affect the number of bees, as their p-values greater than 0.05. This would suggest less swarming risk because the bee population is expected to be lower.

Full Jupyter Notebook screenshots are at the end of this Word document
You are interviewing for a job at a prestigious consulting firm that focuses on solving business problems using analytics. The following are the questions asked by the recruiting manager – they are based on real client problems and questions. For each question, provide a clear and concise answer that shows you understand the material from both a managerial and statistical perspective.
a. Your client is proposing a satisfaction survey which should generate about 5000 responses. One of the questions has potential responses ‘very dissatisfied’, ‘dissatisfied’, ‘no opinion’, ‘satisfied’ and ‘very satisfied’. Since there is a natural ordering to these results, he is not sure if he should code the results 1,2,3,4,5 respectively or -2,-1,0,1,2 respectively. Explain and justify your thoughts on how the data should be coded, and any strengths and weaknesses the choice of coding has. 3 marks
Answer: Since there is a natural ordering to the responses, coding them as 1, 2, 3, 4, and 5 would be more appropriate than coding them as -2, -1, 0, 1, and 2, respectively. The main reason for choosing the first coding option is that it preserves the natural order of the responses, where each number represents a level of satisfaction in increasing order. Satisfaction surveys often use ordinal data, which has a natural order. Coding them as 1,2,3,4,5 has the advantage of providing a clear understanding of the respondents' satisfaction level, which makes it easier to interpret the results from a managerial perspective and would allow for more efficient and robust statistical analysis because it preserves the natural order of the responses. However, the difference between each level of satisfaction may not be equal or meaningful in quantitative terms. For instance, the difference between "Satisfied" and "Very Satisfied" could be more significant than that between "Neutral" and "Satisfied.", even though both differences are coded as one.
b. How could you find a multi-dimensional outlier in a linear regression context? What should you do about it? 3 marks
Answer: From a statistical perspective, to find a multi-dimensional outlier in a linear regression context can be more challenging to identify, but regression plots can be a useful tool for detecting them. Since multi-dimensional can have a disproportionately large impact on the results and conclusions drawn from the data. They can also exert undue leverage and influence on the outcome, potentially distorting the analysis and leading to incorrect conclusions. Use Cook's distance to detect observations with high leverage (Outliers typically have high leverage), those observations with high Cook's distance are considered potential outliers because they have a significant impact on the regression coefficients and the resulting model fit. Additionally, Cook's distance is sensitive to the inclusion of influential observations, so it also can be combined with other methods, such as regression plots for a full-scale outlier analysis. From a managerial perspective, multi-dimensional outliers are usual in each dimension but uncommon when two or more dimensions interact. In real life, it does not make sense for two or more dimensions to interact together. If a multi-dimensional outlier is identified, a decision and assumptions underlying the decision to keep or remove the outlier must be made. Keeping or removing it from the data is based on two factors. Firstly, if the outlier is due to an error or data entry mistake, it should be deleted or corrected. On the other hand, if the outlier is a legitimate data point that falls within the scope of the analysis, it should be retained. However, if the outlier is irrelevant to the analysis, it should be deleted. Furthermore, it may be appropriate to re-run the regression analysis with the outlier removed to assess its impact on the results.
c. Your client is worried about the restrictions imposed on a linear model. She suspects some of the relationships have non-linear patterns like decreasing returns to scale or an exponential shape. What would you tell her? 3 marks
Answer: From a statistical perspective, although it’s a linear model, it can also capture a wide range of non-linear relationships by appropriately transforming the variables. Decreasing returns to scale is widespread to see in real-life business problems. Linear regression can still be used as either a reciprocal function or a polynomial function (Including higher-order polynomial terms in the model, such as squared or cubed terms, to capture the decreasing rate of increase). The transformation for exponential relationships can take the natural logarithm of the dependent variable. The natural logarithm of an exponential function can also produce a linear relationship. Additionally, it is important to carefully validate the assumptions of the model, interpret the coefficients in the context of the original variables, and assess the model's goodness of fit. From a managerial perspective, understanding the shape of the relationship between variables is crucial for business decision-making. By identifying and modelling non-linear relationships, we will better understand the impact of changes in independent variables on the dependent variable and make more accurate predictions.
Jupyter Notebook screenshots for Question 1:
欢迎关注我公众号:AI悦创,有更多更好玩的等你发现!
公众号:AI悦创【二维码】

AI悦创·编程一对一
AI悦创·推出辅导班啦,包括「Python 语言辅导班、C++ 辅导班、java 辅导班、算法/数据结构辅导班、少儿编程、pygame 游戏开发、Linux、Web 全栈」,全部都是一对一教学:一对一辅导 + 一对一答疑 + 布置作业 + 项目实践等。当然,还有线下线上摄影课程、Photoshop、Premiere 一对一教学、QQ、微信在线,随时响应!微信:Jiabcdefh
C++ 信息奥赛题解,长期更新!长期招收一对一中小学信息奥赛集训,莆田、厦门地区有机会线下上门,其他地区线上。微信:Jiabcdefh
方法一:QQ
方法二:微信:Jiabcdefh

更新日志
1c35a-于aed17-于dc26c-于e49b6-于e1b35-于8ed4e-于a3fd7-于299f5-于b1407-于22811-于269da-于56ca0-于458c6-于c9d9d-于4a93e-于62917-于d2f64-于cbb3a-于610fe-于f08aa-于76989-于86c50-于027da-于